
Capnography is a non-invasive monitoring complementary to pulse oximetry, since it assesses oxygenation, and capnography analyzes the patient’s ventilation, measuring exhaled carbon dioxide. In addition, it can assess the patient’s perfusion and metabolism in some cases.
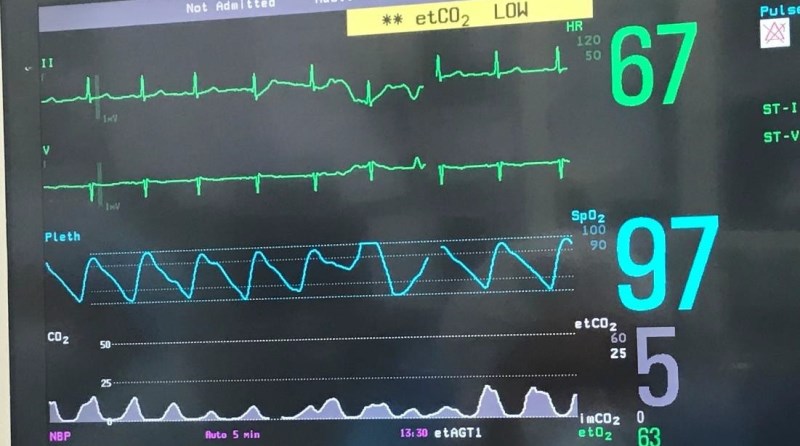
Capnometry indicates the tension (or concentration) of CO2 in the expired gas during the respiratory cycle (EtCO2). This is related to the concentration of CO2 at the alveolar (PACO2) and arterial (PaCO2) level.
The measurement of EtCO2 during anesthesia is useful for evaluating respiratory functionality, and indirectly cardiovascular activity, cellular metabolism and the correct functioning and positioning of the respiratory circuit.
What is etco2?
Is the numerical measurement and display of end expiratory carbon dioxide, also known as capnography.
The graphical representation of the concentration or partial pressure of expired carbon dioxide during a respiratory cycle is shown in the form of a wave and is known as a capnogram.
This provides information not only about pulmonary function, but also indirect cardiac function, ventilatory function, and perfusion.
Capnography waveforms
When it comes to capnography, everyone knows the normal adult respiratory rate of 12 to 20 breaths per minute and most people know, or quickly learn, that the normal amount of exhaled CO2 is 35 to 45 mmHg. What can be intimidating is the idea of reading the waveform, but in practice it is not difficult at all.
An end-tidal capnography waveform is a simple graphical measure of the amount of CO2 a person exhales.
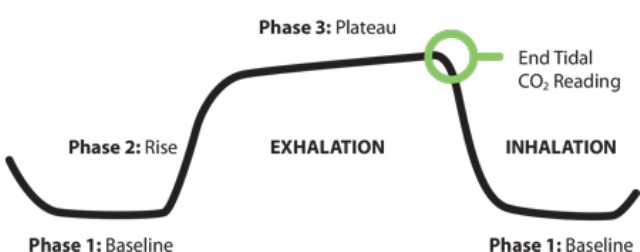
The normal tidal end capnography waveform is basically a rounded rectangle. When a person exhales CO2, the graph goes up. When a person is inhaling, they go back down.
Although it can be intimidating trying to memorize what each phase represents (and the angles between them), you can think of it this way: the left side shows how quickly and easily air moves out of the lungs; the right side shows how quickly and easily the air enters; the upper part shows how easily the alveoli empty.
If all we wanted to read from capnography was ventilation, this would be enough, but to indirectly measure a patient’s perfusion and metabolic status we need to understand how CO2 gets to the lungs to be exhaled.
Capnography waveforms interpretation
Phase 1 is inhalation: This is the baseline. Since no CO2 comes out when a patient inhales, the baseline is usually zero.
Phase 2 is the beginning of exhalation: CO2 begins to travel from the alveoli through the anatomical dead space of the airways causing a rapid rise in the graph as CO2.
Phase 2 measures the CO2 exhaled from the alveoli mixed with the gas that was in the dead space. This part of the graph rises as the more concentrated CO2 gases from the lower part of the lungs rise past the sensor.
Phase 3 is when the sensor is receiving the CO2-rich gas that was in the alveoli: Since this is a fairly stable quantity, the graph levels out at a plateau. The measurement at the end of the breath stream, the maximum measurement at the end of phase 3, is the EtCO2 reading.
After the end of phase 3, the patient inhales again, drawing clean air past the sensor, lowering the graph to zero to start phase 1 again.
Normal oxygen saturation by age
Human beings depend on oxygen for life. All organs require oxygen for metabolism but the brain and heart are particularly sensitive to a lack of oxygen.
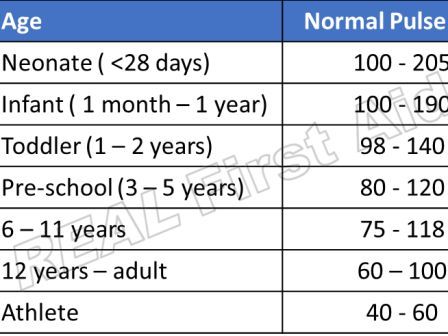
SpO2 normal range by age Chart
This reading chart provides guidance on what oxygen level means and when and how to seek medical help.
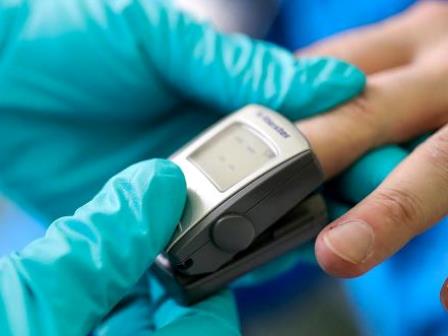
Pulse Oximeter Price
The use of medical devices such as pulse oximeters has increased dramatically in recent years. Let’s find out the prices and the best brands.