
What is an underwater topography maps?
A map is a representation of the Earth or part of it. The distinctive characteristic of a topographic map is that the shape of the Earth’s surface is shown by contour lines. Contours are imaginary lines that join points of equal elevation on the surface of the land above or below a reference surface, such as mean sea level. Contours make it possible to measure the height of mountains, depths of the ocean bottom, and steepness of slopes.
A topographic map shows more than contours. The map includes symbols that represent such features as streets, buildings, streams, and vegetation.
These symbols are constantly refined to better relate to the features they represent, improve the appearance or readability of the map, or reduce production cost. Consequently, within the same series, maps may have slightly different symbols for the same feature.
Examples of symbols that have changed include built-up areas, roads, intermittent drainage, and some lettering styles. On one type of large-scale topographic map, called provisional, some symbols and lettering are hand-drawn.
Underwater topographic maps
Types of Underwater Topography Maps:
Underwater contours
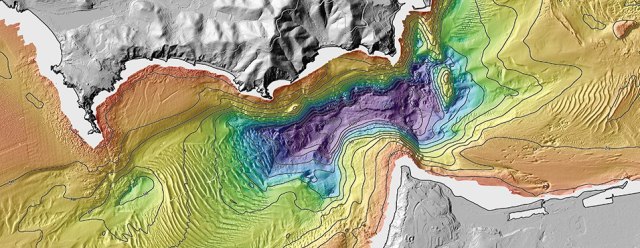
Bathymetric map
Topographic maps of the seafloor. Detailed depth contours provide the size, shape, and distribution of underwater features. The map serves as a tool for performing scientific, engineering, marine geophysical and environmental studies, that are required in the development of energy and marine resources. (Underwater Topography Maps)
Geological survey
Topo/Bathy Maps: Detailed multipurpose maps of NOS bathymetry and US Geological Survey (USGS) land topography. Maps support the Coastal Zone Management and Energy Impact Programs and the offshore oil and gas program.
They may also be used by land-use planners, conservationists, oceanographers, marine geologists, and those interested in the coastal zone and the Outer Continental Shelf’s (OCS) physical environment. All 1:250,000 and 1:1000,000 maps are overprinted with the Minerals Management Service’s OCS Protraction Diagram data. (Underwater Topography Maps)
Bathy fishing maps
Topographic maps of the seafloor produced at a 1:100,000 scale that contains Loran-C rates, bottom sediment types and known bottom obstructions. This product is intended to aid fishermen and those needing seafloor features and potential fishing grounds.
Geophysical mapping
Geophysical Maps: Each consist of three sheets (a base bathymetric map, a magnetic map, and a gravity map), and where practicable a sediment overprint (NOS 1308N-17S). The bathymetric map, when combined with the other three maps, serves as a base for making geological-geophysical studies of the oceans bottom’s crustal geophysical data for the Continental Shelf and slope. The SEAMAP SERIES at a scale of 1:1,000,000, covers geophysical data gathered in the deep-sea area, sometimes including the adjacent Continental Shelf and Slope. (Underwater Topography Maps)
Preliminary Bathymetric Maps
Bathymetric maps that have been compiled, but are not published. NOAA provides blackline copies of compilation manuscripts for bathymetric maps that were left in the production process but are sufficiently developed to include accurate bathymetric data. There are no plans to have these maps published.
Regional Maps
1:1,000,000 scale maps compiled from 1:250,000 scale bathymetric maps.
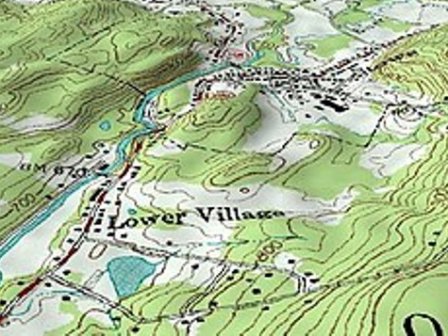
Reading topographic maps
Underwater contours Maps: Interpreting the colored lines, areas, and other symbols are the first step in using topographic maps. Features are shown as points, lines, or areas, depending on their size and extent. For example, individual houses may be shown as small black squares. For larger buildings, the actual shapes are mapped. In densely built-up areas, most individual buildings are omitted and an area tint is shown. On some maps, post offices, churches, city halls, and other landmark buildings are shown within the tinted area.
The first features usually noticed on a topographic map are the area features, such as
- vegetation (green)
- water (blue), and
- densely built-up areas (gray or red).
Many features are shown by lines that may be straight, curved, solid, dashed, dotted, or in any combination. The colors of the lines usually indicate similar classes of information:
- topographic contours (brown);
- lakes, streams, irrigation ditches, and other hydrographic features (blue);
- land grids and important roads (red); and other
- roads and trails, railroads, boundaries, and other cultural features (black).
Bathymetric contours are shown in blue or black, depending on their location. They show the shape and slope of the ocean bottom surface. The bathymetric contour interval may vary on each map and is explained in the map margin.
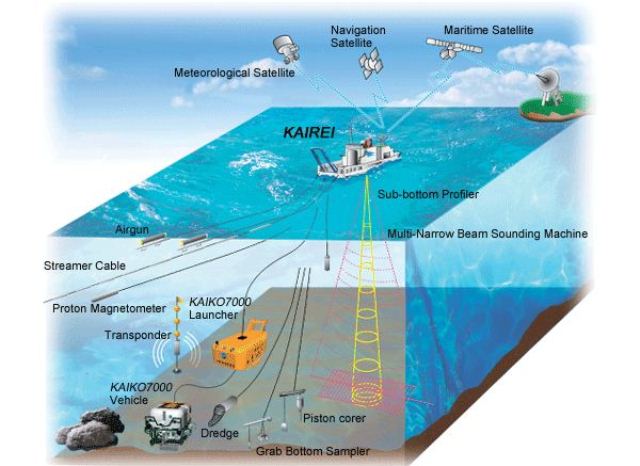
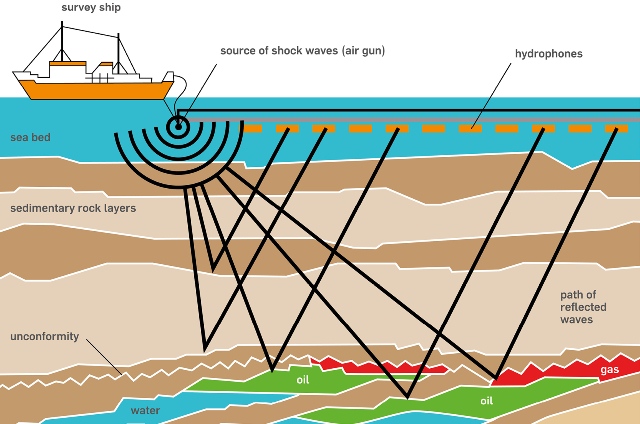
Offshore exploration
Exploration in offshore is an important and costly affair for offshore exploration companies. The mighty ocean survey is not only expensive but also be consuming.
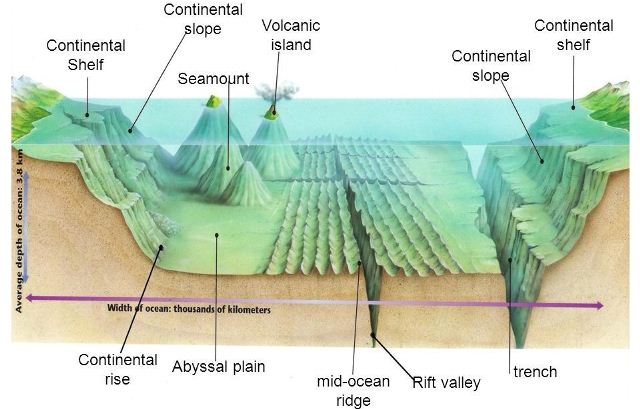
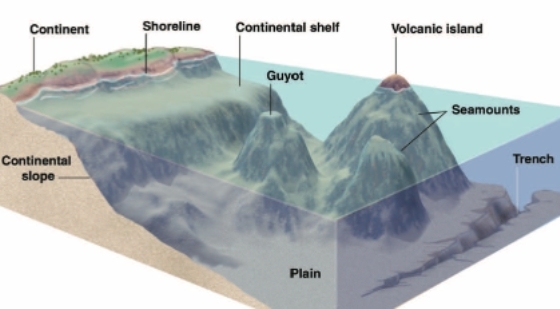
Remote sensing has opened up a new tool for offshore exploration. The ocean floor is characterized by the presence of numerous seamounts, atolls, ridges, trenches, etc.
The variation in relief constitutes the morphology of the ocean floor. Charting of the ocean is very important for many reasons: it affects circulation, a potential site for living and non-living resources, submarine navigation, geophysical exploration, etc.
Most areas of the oceans are uncharted because ships could map only a small fraction of the seafloor.
In brief bathymetry is the seafloor-relief.
Undersea topography
Detailed bathymetry data of the seafloor in offshore is sparse as bathymetry data collection is expensive and me-consuming and complete coverage of the whole area by ship is a daunting task to be achieved in the years to come.
Hence, bathymetry prediction using high-resolution satellite gravity may be a viable op on in the unexplored regions. The most commonly used model to relate gravity with bathymetry is a convolution model. Bathymetry, when convolved with a response function, yields geoid or gravity.
The surface of the ocean is a good approximation to the marine geoid. A major contribution to the marine geoid is made by topographic anomalies in the very shallow rock water interface at the base of the ocean because this surface represents the large density contrast. The largest contrasts occur at the earth’s surface and at the ocean bottom (or at the base of the sediments in the ocean) and are affected by seafloor undulations. Consequently, there is a strong correlation between the shape of the geoid and ocean bottom topography.
What is bathymetric data?
Bathymetry is the study of underwater depth of lake or ocean floors. In other words, bathymetry is the underwater equivalent to hypsometry or topography.
Bathymetry is the measurement of the depth of water in oceans, rivers, or lakes. Bathymetric maps look a lot like topographic maps, which use lines to show the shape and elevation of land features.
The variation in relief constitutes the morphology of the ocean floor. Charting of the ocean is very important for many reasons: it affects circulation, a potential site for living and non-living resources, submarine navigation, geophysical exploration, etc. In brief, bathymetry is the seafloor-relief.
Topographic maps of the seafloor. Detailed depth contours provide the size, shape, and distribution of underwater features. The map serves as a tool for performing scientific, engineering, marine geophysical and environmental studies, that are required in the development of energy and marine resources.
According to the ICSM (Intergovernmental Committee on Surveying and Mapping), there are five different types of maps: General Reference, Topographical, Thematic, Navigation Charts and Cadastral Maps and Plans
Types of Topographical Survey
While most people think of land surveys in the most basic sense, that is, the drawing of the boundaries of property, there are actually many different ways of surveying that service many different industries.
Bathymetric Survey
The variation in relief constitutes the morphology of the ocean floor. Charting of the ocean is very important for many reasons: it affects circulation, a potential site for living and non-living resources, submarine navigation, geophysical exploration, etc.